Sizing for high query rates
This page helps you size a QueryFlux fleet for a target query rate: control-plane replicas, connection pools, Postgres, and the capacity mode. How each piece works is on Capacity and throughput.
All numbers here come from the capacity benchmark (queryflux-bench capacity, see Benchmarks) on a laptop against a local, durable Postgres 17. Treat them as orders of magnitude. Run the benchmark against your own Postgres before you commit to a size.
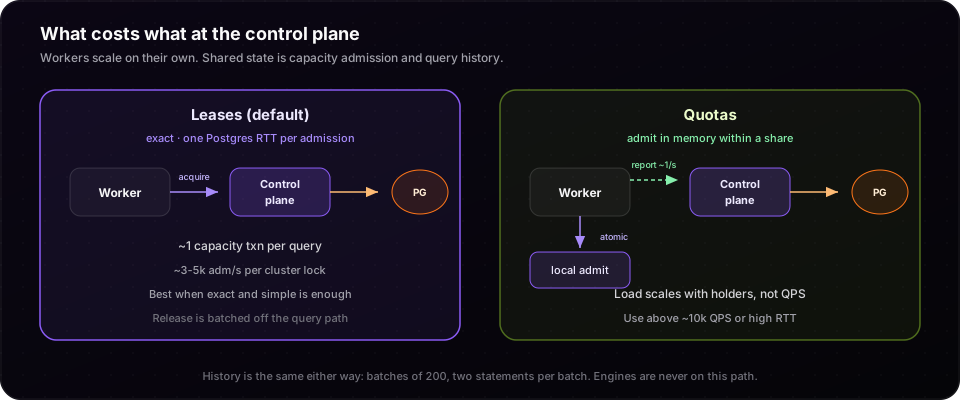
What costs what
Only shared state costs anything at the control plane: capacity admission and query history. Workers scale out on their own. Everything else a query does (routing, translation, the engine call) happens on the process that runs it.
| Per query | capacity.mode: leases | capacity.mode: quotas |
|---|---|---|
| Admission | one call into Postgres (one round trip from a worker) | an atomic counter on the process, no I/O, while it is within its share |
| Release | queued and sent in batches | nothing |
| History | part of a batch of up to 200 records: one transaction, two statements | same |
| Postgres transactions for capacity | about 1 per query | about 1 per holder per second, plus the reserve |
Pick a capacity mode
-
Leases (the default) are exact and simple. Each admission is one short call into Postgres. One cluster takes about 3,000–5,000 admissions per second before its per-cluster lock is the limit. Across many clusters, the coordination pool and Postgres are the limit.
-
Quotas (
capacity.mode: quotas) give each process a share of every limit, so most admissions do no I/O. Control-plane load then depends on the number of processes, not the query rate. Use quotas when:- one cluster needs more than a few thousand admissions per second; or
- the whole fleet needs more than about 10,000 per second; or
- workers are far from the control plane, so a round trip per query is too slow.
Quotas need every standalone or control-plane replica on a version that has them (see Capacity quotas).
-
Small limits (
maxRunningQueriesbelow twice the number of processes that admit queries) get no quotas either way: every admission takes a lease, which is exact.
Running near the limit
When a cluster is full, waiting queries are served first come, first served: a freed slot is handed to the oldest waiter. That bounds waits (in the benchmark, p99 about 0.1 s under contention, against 3–14 s with retries on a timer). A handed-over slot sits idle for a few milliseconds until its waiter claims it. For very short queries (tens of milliseconds) at the limit, that costs about 5% of peak throughput; for queries that run seconds it is negligible. If a cluster runs at its limit most of the time, raise maxRunningQueries (if the engine can take it) rather than rely on the line.
Control plane
Replicas. Control-plane replicas are stateless HTTP in front of Postgres; add them for availability and for HTTP and TLS load, not for capacity throughput. Two or three are enough for most fleets. Postgres is the shared component.
Connection pools, per replica:
| Pool | Default | Size it to |
|---|---|---|
coordinationPoolSize | 8 | capacity calls in flight at peak: admissions per second × ~1 ms (more with a remote Postgres). With quotas: demand reports and reserve leases. |
queryPoolSize | 7 | queries in flight on this replica that touch persisted query state |
adminPoolSize | 2 | admin API, config reloads, history ingest (two batches at once) |
Each replica also holds one LISTEN connection for config changes and, once queries wait for capacity, one for capacity hand-overs. Add the pools across replicas, plus workers' none (workers never connect to Postgres), and check Postgres max_connections.
Postgres
What a control plane's Postgres does per second, roughly:
| Workload | Leases | Quotas |
|---|---|---|
| Capacity, per admission | ~1 transaction, 1 statement | — |
| Capacity, per holder | — | ~1 transaction per report (every second, every 250 ms while queries wait) |
| Allocator | — | 1 transaction every 200 ms, all clusters together |
| History | 1 transaction per 200 records | same |
| Retention | batches of 10,000 rows, hourly | same |
So 5,000 queries per second on leases is about 5,000 capacity transactions per second plus 25 history transactions; on quotas with 100 workers, about 100–400 capacity transactions per second. Measured history ingest is about 24,000 records per second into one Postgres.
Choose an instance that keeps commit latency low: every capacity call commits, and a slow commit holds the cluster's lock longer, which lowers the per-cluster ceiling. Synchronous replication adds its latency to every commit.
Workers
Workers are sized like any QueryFlux process: by the queries they run. The capacity path adds little:
- with leases, one round trip per query to the control plane, and releases batched;
- with quotas, one report per second.
On a cache miss, translation and access-control parsing take milliseconds of Python per query, and Python runs one at a time per process. Repeated queries hit the translation caches instead.
Metrics that show you are running out
| Metric | Means |
|---|---|
queryflux_coordination_failures_total rising | capacity calls fail: Postgres or the control plane is unreachable or overloaded |
queryflux_capacity_lease_denied_total high while engines are idle | the shared limit is the bottleneck, not the engines; with leases, consider quotas |
queryflux_queue_duration_seconds p99 rising | queries wait for capacity; compare across workers |
queryflux_capacity_quota{kind="waiting"} high with kind="quota" low | a holder wants more than its share; the allocator moves capacity within about a second |
History historyUplink.queued growing on workers | the control plane's Postgres can't keep up with history |
Not built: a capacity coordinator in memory
The plan considered one more step: one control-plane replica, elected through Postgres, holding every cluster's counters and line in memory, with the others forwarding to it. Admissions would take microseconds, at the cost of a failover pause and more moving parts. With quotas, admissions within a share already do no I/O and the measured limits are well above the targets, so it hasn't been needed. It remains the option if a deployment outgrows quotas.